Observability Has Become a Multi-Tool Problem
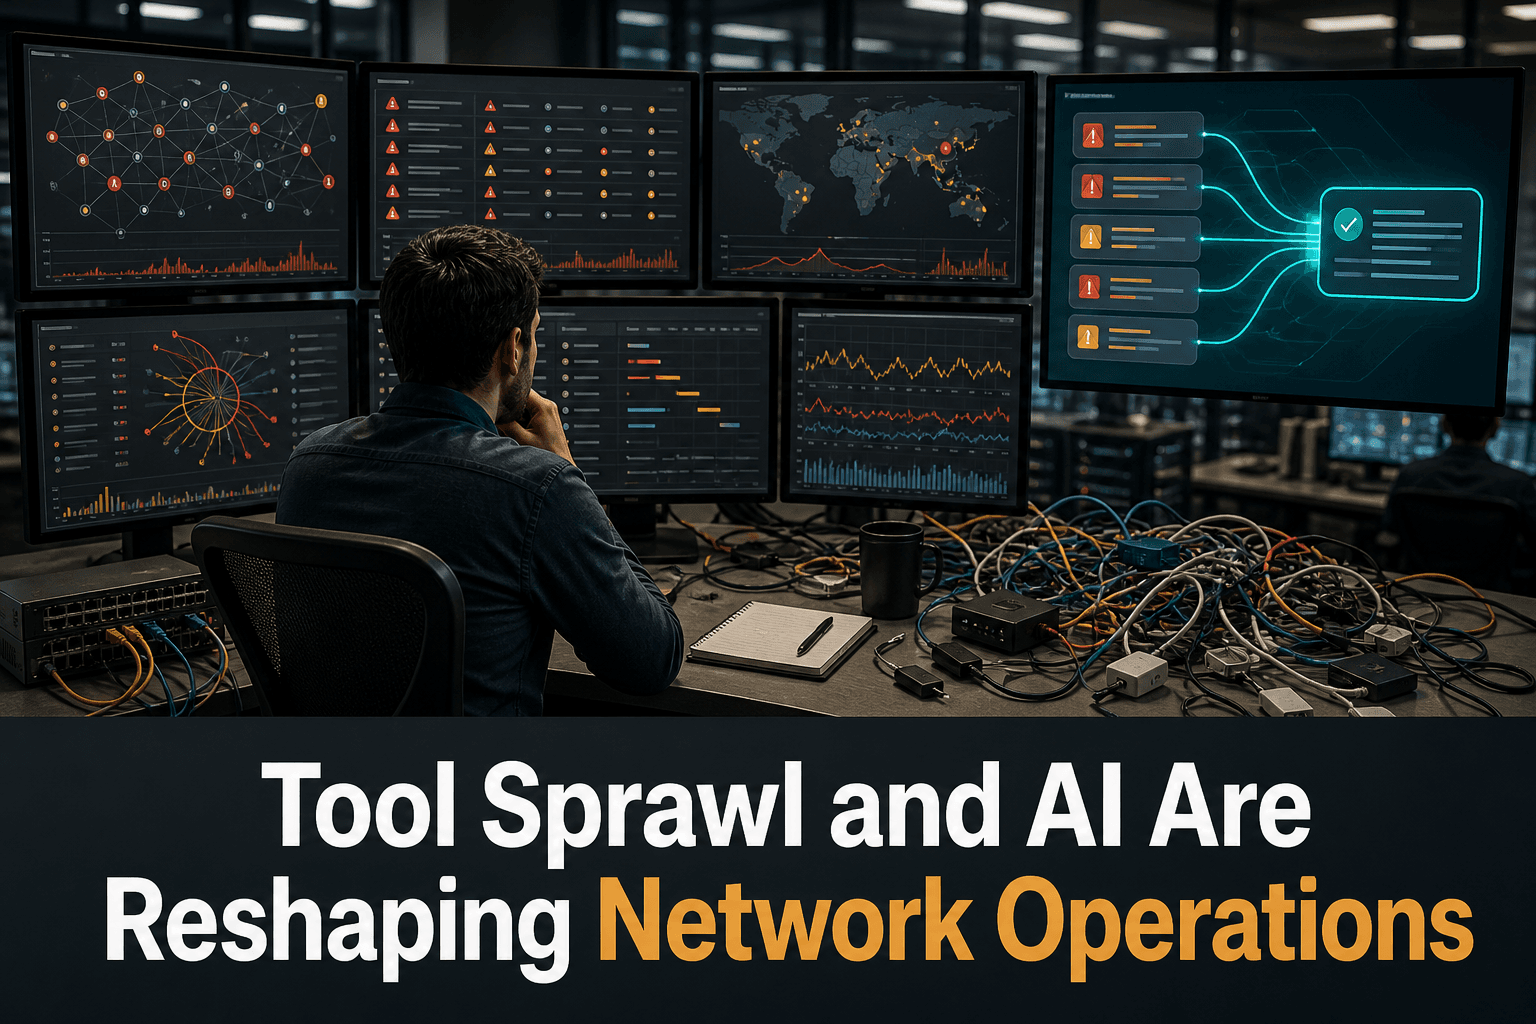
Enterprise organizations typically operate six to eight observability tools, according to research from Enterprise Management Associates (EMA). Based on a survey of 356 enterprise IT professionals, the findings show that this fragmentation is consuming engineering time and making investigations harder.
Unification remains a work in progress for most respondents:
51% had tool-unification initiatives under way.
32% were planning or evaluating unification.
17% said they had completed the process.
Larger organizations generally reported using more observability tools. Yet consolidation does not necessarily lead to one universal interface.
“One of the first things I can say is no one gets a single pane of glass,” said Shamus McGillicuddy, vice president of research at EMA.
The operational objective, therefore, is not simply to force every signal into one product. It is to make data, context, and workflows coherent enough for teams to investigate incidents without repeatedly switching tools or manually reconstructing events.
The Operational Cost of Fragmentation
EMA respondents identified several direct consequences of tool sprawl:
45% cited skills and staffing burdens associated with operating multiple tools.
44% said integration and API complexity consumed engineering time.
41% reported that context switching slowed investigations and response.
40% experienced greater manual effort.
34% said alert noise caused toil and cognitive overload.
The broader effects include higher total cost of ownership, inconsistent data quality, coverage gaps, and slower incident detection and resolution.
A particularly difficult scenario occurs when each technical domain appears healthy in isolation. Network, cloud, and application tools may all report normal conditions while users continue to experience a service problem. Without shared context, teams can struggle to correlate the signals that reveal the actual anomaly.
AI Can Correlate Signals, but Not Repair Bad Operations
AI is already taking on part of the observability workload. EMA found that 32% of respondents used AI extensively across observability tools, while 51% used it in selected areas and 13% were still piloting it.
Reported use cases included:
Incident summaries and explanations
Alert correlation and noise reduction
Anomaly detection
Capacity forecasting
Predictive analytics
Root-cause analytics
Organizations making extensive use of AI also expressed greater confidence in their observability-unification strategies. However, fragmented or inconsistent data can undermine AI results. Respondents additionally raised concerns about inaccurate output, security, and compliance risks.
“AI can overcome data fragmentation across tools, but it’s not going to overcome bad data and bad operations in general,” McGillicuddy said.
AI should therefore be treated as an operational accelerator, not a substitute for data quality, disciplined processes, and clear ownership.
Governance Before Simplification
EMA research director Parker Hathcock warned that the effects of tool sprawl can compound one another. Strong tool governance is consequently an essential first step.
A practical approach can include:
Inventory tools and ownership. Identify what each tool monitors, who operates it, and which teams depend on its data.
Map overlapping capabilities. Find duplicate collection, alerting, reporting, and retention functions.
Assess data quality. Confirm that asset names, timestamps, identifiers, and topology context are consistent enough to correlate.
Prioritize integrations by operational value. Focus first on connections that reduce investigation time or manual handoffs.
Define AI guardrails. Establish how generated findings are validated and how security or compliance requirements apply.
Measure outcomes. Track incident-detection time, resolution time, alert volume, manual effort, and context switching.
This governance-led model is more realistic than pursuing a universal “single pane of glass.” It focuses on reducing operational friction while preserving tools that remain valuable for specialized domains.
How ConnectMyAssets Helps
ConnectMyAssets helps reduce fragmentation around the network-infrastructure lifecycle without requiring every observability function to be replaced. Its Dynamic CMDB and Topology modules provide a shared inventory and relationship context for multi-vendor assets, giving operations teams a more consistent foundation for investigations.
The Backup & History module adds configuration versioning and one-click rollback, helping teams determine whether a recent change may be associated with an incident. The Compliance Engine supports consistent control checks across frameworks including NIS2, ISO 27001, PCI, CISA, and NIST, while per-asset CVE Tracking and End-of-Life Tracking add security and lifecycle context.
For repeatable operational work, Automation & ZTP can reduce manual effort across supported network processes. The local AI Insights module provides on-premises analysis, allowing organizations to apply AI-assisted insights while keeping the platform and its operational context within their own environment.
The goal is not to promise one screen that replaces every specialist tool. It is to establish trustworthy asset, configuration, compliance, vulnerability, and lifecycle data so that engineers spend less time reconstructing context and more time resolving problems.
Source: Network World